Management Discussion and Analysis
Financial Capital


Financial capital refers to the pool of financial resources SLT Group utilises to acquire the assets and to fund the operations of the Group. By combining the financial capital with the other types of capital such as customer capital and employee capital, we create value for the short, medium and long-term for the Group and to all our stakeholders.
This section is an overview of our financial position and performance for the year under review, at both Group and Company level. The information presented below is duly supplemented with the Financial Statements and Notes.
In this section, "the Group" refers to Sri Lanka Telecom PLC and its subsidiaries and "the Company" refers to Sri Lanka Telecom PLC.
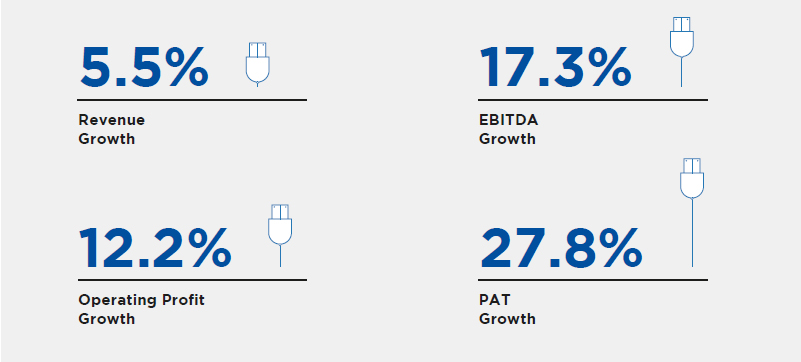
Group Financial Highlights – 2019
Revenue
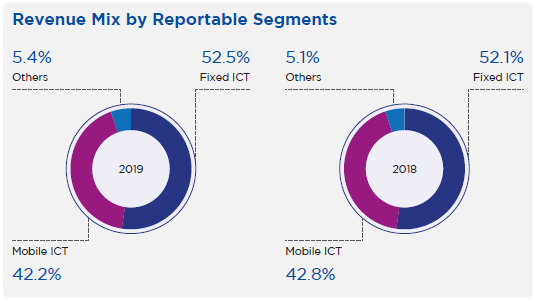
The Group recorded a revenue growth of 5.5% in 2019 compared with the year before to LKR 85.9 Bn. primarily driven by the growth in revenues of both Fixed ICT and Mobile ICT segments. The Group’s Fixed ICT segment which is operated by Sri Lanka Telecom PLC (the Company) reached a milestone by reporting LKR 50.0 Bn. revenue for the year achieving a 5.5% growth compared to 2018. The growth was largely underpinned by the remarkable increase of revenues of Fibre-to-the-Home (FTTH), LTE, PEO TV, Enterprise Solutions, Career Domestic and International Settlements. The mobile arm of the Group, Mobitel (Pvt) Ltd (Mobitel), which operates the Mobile ICT segment, recorded LKR 40.2 Bn. revenue, a 3.3% YoY growth stemming from the increase of Mobile Broadband revenues, primarily due to the increase of Broadband reach during the year under review.
The revenues are expected to further rise in the future with the ongoing accelerated Fibre Expansion Project under the National Fiberisation Program. Further, the Group focuses on the growing trend of over-the-top (OTT) services which will increase the demand for data and the Internet of Things (IoT) which will create new revenue streams.
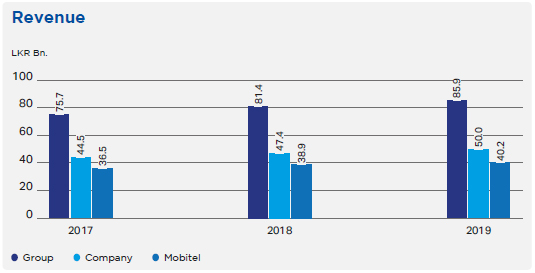
The below graphs illustrate the revenue mix by reportable segments in 2019 compared to the previous year.
EBITDA & Operating Profit
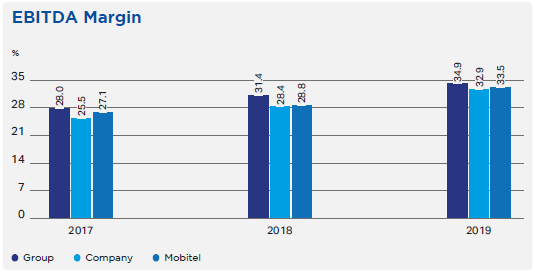
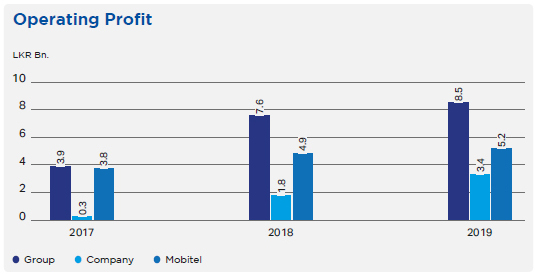
The Group’s Earnings Before Interest, Tax, Depreciation & Amortisation (EBITDA) rose to LKR 30.0 Bn., reflecting an impressive 17.3% YoY growth due to the increased revenues and operational efficiency achieved through the Group’s cost management initiatives. This pushed the EBITDA margin up to 34.9% from 31.4% in 2018. The Group maintained the Operating Expenses excluding Depreciation & Amortisation, with a slight increase of 0.1% in 2019 compared to 2018 at LKR 56.0 Bn. Depreciation and Amortisation for the year was LKR 21.4 Bn. which is a 19.5% increase compared to 2018 due to the growing capital expenditure. The Operating Profit grew by 12.2% YoY reaching LKR 8.5 Bn. for the year under review.
The Company’s EBITDA increased to LKR 16.5 Bn., a 22.3% YoY growth while improving the EBITDA margin to 32.9% from 28.4% in 2018. The Company’s Operating Expenses excluding Depreciation & Amortisation stood at LKR 33.6 Bn., which is a reduction of 1.1% compared with the previous year. The decline in repair and maintenance costs and the SLFRS 09 – Financial Instruments and SLFRS 16 - Leases adjustments impacted favourably to the EBITDA. The Depreciation and Amortisation increased to LKR 13.1 Bn. during the year from LKR 11.6 Bn. in 2018, which included the impact of SLFRS 16 adjustment. The increase in revenue coupled with the reduction in Operating Expenses resulted a 82.0% YoY remarkable growth in Operating Profit to LKR 3.4 Bn.
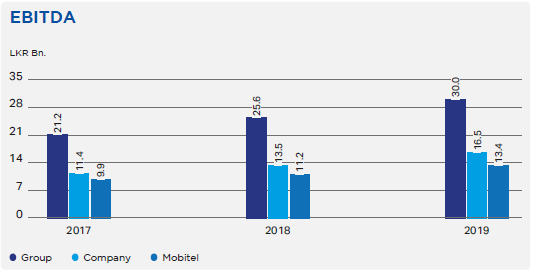
The SLFRS 16 adjustment had a significant impact on the profitability of Mobitel too. Mobitel recorded a growth in EBITDA and Operating Profit for 2019 which is a YoY increase of 20.2% and 6.2% respectively. While there was a positive impact on EBITDA and Operating Profit, the adjustment had an adverse impact on Profit After Tax of Mobitel in 2019.
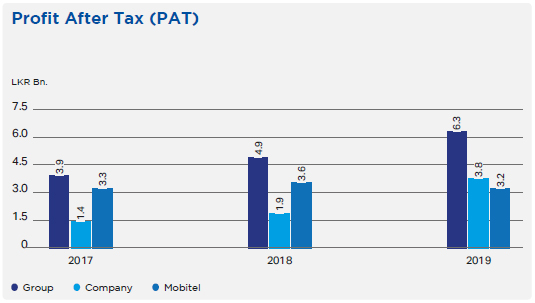
Profit After Tax (PAT)
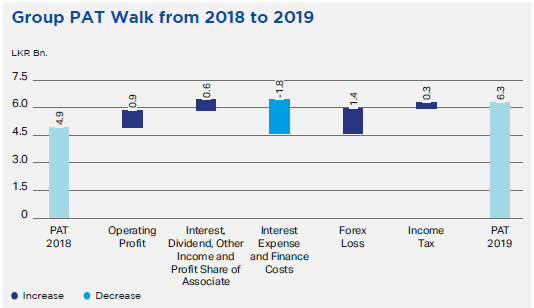
The Group concluded the financial year 2019 on a high note, with 27.8% YoY growth in Profit After Tax (PAT) at LKR 6.3 Bn. The impressive growth was strongly underpinned by the increase in revenues and the Group’s cost management initiatives. The Group managed the Forex losses at LKR 443 Mn. for the year from LKR 1.8 Bn. in 2018 as a result of the reduction of foreign currency denominated borrowings and effective hedging strategies. However, the Interest Expense and Finance Costs increased by LKR 1.8 Bn. to LKR 2.1 Bn. primarily due to the adverse impact of SLFRS 16 adjustment and increased borrowings to finance the growing capital expenditure in order to align with the global technological trends and fulfil changing customer demands. The Interest Income increased by 88.0% YoY, reaching LKR 1.3 Bn. The Profit Before Tax (PBT) stood at LKR 8.2 Bn., a 14.6% YoY growth.
The following graph illustrates the movement of Group PAT in year 2018 to 2019.
The PAT of the Company almost doubled to LKR 3.8 Bn. during the year from LKR 1.9 Bn. in 2018. Higher Operating Profit, reduction in Forex losses by LKR 886 Mn. and increase in Interest Income by LKR 296 Mn. contributed positively to the profits while increase in Interest Expense and Finance Costs by LKR 597 Mn. impacted negatively. The PBT rose by 51.3% YoY to LKR 4.8 Bn. in 2019.
The PAT of Mobitel recorded at LKR 3.2 Bn. compared to LKR 3.6 Bn. in 2018, while the PBT recorded at LKR 4.1 Bn. compared to LKR 4.4 Bn. in the year before. The SLFRS 16 adjustment made an adverse impact on the PBT and PAT of Mobitel even though it positively impacted on EBITDA and Operating Profits.
The Group paid a total of LKR 25.5 Bn. as Direct and Indirect taxes and other contributions to the Government of Sri Lanka during the year 2019.
Earnings Per Share (EPS) of the Group grew from LKR 2.74 in 2018 to LKR 3.50 for the year under review.
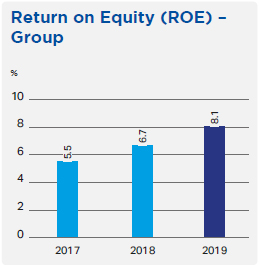
Return on Equity – Group
Net profit attributable to the owners, expressed as a percentage of average ordinary shareholders’ equity for the year grew to 8.1% compared to 6.7% in 2018 due to the improved Profit After Tax in 2019.
Assets
The asset base of the Group comprised of 77.6% of Non-Current Assets and 22.4% of Current Assets as at 31 December 2019. Property, Plant & Equipment accounted for 86.6% of the total Non-Current Assets and recorded at LKR 140.6 Bn. as at the reporting date. During the year, the Group invested LKR 29.0 Bn. in Property, Plant & Equipment and Intangible Assets in comparison to LKR 21.4 Bn. investment in 2018. During the year under review, the Group continued its strategic investments mainly directed at the expansion of Fibre-to-the-Home (FTTH) network, Internet Protocol Television (IPTV) platform, 4G/4.5G LTE network and the Optical Fibre Core Network. As a Group operating in the telecommunications industry, continuous investments in latest technologies are vital in order to align with the global technological trends and to meet evolving customer demands.
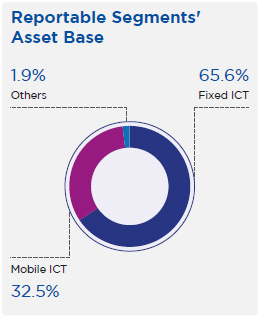
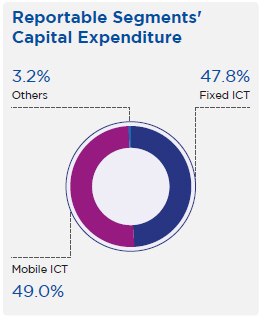
The below graphs depict the asset base and the capital expenditure made by the reportable segments of the Group. The Fixed ICT segment which is operated by the Company accounted for 65.6% of the total asset base of the Group in comparison to 32.5% of Mobile ICT segment operated by Mobitel due to the more capital intensive nature of fixed telecommunication services than the mobile telecommunication services.
Capital Structure
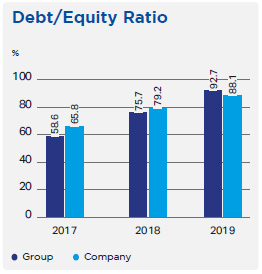
The Group’s equity position improved by 6.0% as at 31 December 2019 to LKR 78.2 Bn., primarily due to the accumulation of profits during the year. Debt/Equity Ratio of the Group increased from 75.7% in 2018 to 92.7% in 2019 due to the increased borrowings to meet the growing capital expenditure and creation of Lease Liability as required in SLFRS 16. The total Borrowings and Lease Liability of the Group reached LKR 72.4 Bn. as at 31 December 2019 compared with LKR 55.8 Bn. as at 31 December 2018. However, the Group has reduced foreign currency denominated borrowings and uses effective hedging strategies to mitigate the exposure from fluctuations in the foreign exchange rates.
The Company’s Debt/Equity Ratio increased from 79.2% in 2018 to 88.1% for the year under review. The Company’s Borrowings and Lease Liability position increased to LKR 53.0 Bn. as at the end of the reporting period of 2019 from LKR 46.0 Bn. in 2018.
Cash Flow
The Group’s cash generated from operations improved to LKR 29.3 Bn. in 2019 compared to LKR 24.0 Bn. in 2018. However, due to the increased interest payments in 2019 compared to 2018 as a result of increased borrowings, net cash generated from operating activities improved slightly to LKR 20.4 Bn. from LKR 19.7 Bn. in 2018. Net cash used in investing activities recorded an outflow of LKR 28.3 Bn. due to the increased capital expenditure. Net cash generated from financing activities reported an inflow of LKR 5.0 Bn. for the year under review. The Group was able to manage a positive Cash and Cash Equivalents balance of LKR 1.7 Bn. as at the end of the reporting period.
The Company recorded a reduction in net cash generated from operating activities from LKR 11.3 Bn. in 2018 to LKR 9.8 Bn. in 2019, due to the rise in interest payments. Net cash used in investing activities recorded an outflow of LKR 13.7 Bn. primarily due to the acquisition of Property, Plant and Equipment and Intangible Assets of LKR 13.9 Bn., while net cash generated from financing activities reported an inflow of LKR 6.2 Bn. As the cash inflows of the year outstripped the cash outflows by LKR 2.3 Bn., the Company was able to reduce the negative Cash and Cash Equivalents position of LKR 5.0 Bn. as at the beginning of the year to negative LKR 2.6 Bn. as at the reporting date.
Value Added Statement
| 2019 LKR Mn. |
% |
2018 LKR Mn. |
% | |||
Value Added |
||||||
| Revenue | 85,948 | 81,445 | ||||
| Other Income | 2,187 | 1,604 | ||||
| 88,135 | 83,049 | |||||
| Goods & Services purchased from other sources | (31,693) | (34,065) | ||||
| Value creation | 56,442 | 48,984 | ||||
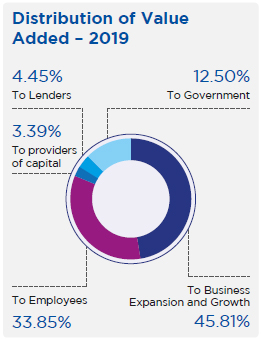
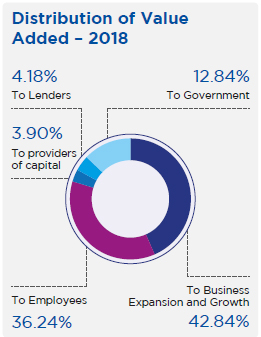
Distribution of Value Added |
||||||
| To Employees | ||||||
| – Salaries, wages and other benefits | 19,108 | 33.85 | 17,750 | 36.24 | ||
| To providers of capital | ||||||
| – Dividend to shareholders | 1,913 | 3.39 | 1,913 | 3.90 | ||
| To Government | ||||||
| – Taxes & Regulatory fees | 7,057 | 12.50 | 6,290 | 12.84 | ||
| To Lenders | ||||||
| – Interest & Related charges | 2,510 | 4.45 | 2,048 | 4.18 | ||
| To Business Expansion & Growth | ||||||
| – Depreciation | 21,445 | 37.99 | 17,948 | 36.64 | ||
| – Retained Income | 4,409 | 7.82 | 3,035 | 6.20 | ||
| 56,442 | 100.00 | 48,984 | 100.00 |