Investor capital
We have nurtured quality relationships with our investors. Our investors constitute individuals and institutions that provide us with financial capital, seeking reciprocal returns for the short, medium, and long-term. Through the interaction of various forms of financial and non-financial capital, we create value for the Company and in turn deliver value to our key stakeholders. Our relationship with our investors is one of mutual trust and accountability.
Shareholder profile
The two main shareholders of Sri Lanka Telecom PLC (SLT) as at the year end were the Government of Sri Lanka (holding a 49.50% stake in SLT through the Secretary to the Treasury) and Global Telecommunications Holdings (GTH) N.V. which owned a stake of 44.98%. The remainder of 5.52% constitute the shares that are publicly traded on the Colombo Stock Exchange.
Government of Sri Lanka
As the primary shareholder of SLT, the Government of Sri Lanka offers many consumers a feeling of reassurance and confidence in the products and services we offer. They are thus ensured of superior quality and levels of service. This position is further meliorated by SLT’s long-standing role as a figurehead in the telecommunications sector; and its current position as the national ICT service provider, and ICT services provider.
Global Telecommunication Holdings N.V.
Global Telecommunication Holdings N.V. is the holding company of Maxis, the Malaysia-based telecommunication company. Maxis provides technical and telecommunication expertise to SLT.
Stability
The stability and long-term viability of SLT is of supreme importance, not just for our shareholders but for the entire country. Our ratings are sound, as detailed below:
Fitch rating
National long-term rating of AAA(lka).
Standard and Poor's rating
Long-term corporate credit rating of B+.
Investor relations
SLT briefs its shareholders and associated parties on performance through numerous means. These include, but are not limited to: press releases, release of interim financial results, the Annual General Meeting, our web portal, and announcements on the Colombo Stock Exchange. SLT’s Annual Report offers comprehensive details on all relevant financial and non-financial information.
Distribution of shares
| Resident | Non-resident | Total | |||||||
| Shareholdings |
No. of shareholders |
No. of
shares |
(%) |
No. of shareholders |
No. of shares |
(%) |
No. of shareholders |
No. of shares |
(%) |
|
1 – 1,000 shares |
9,677 | 2,907,550 | 0.16 | 15 | 5,847 | 0.00 | 9,692 | 2,913,397 | 0.16 |
| 1,001 – 10,000 shares | 2,291 | 9,003,371 | 0.50 | 23 | 115,490 | 0.01 | 2,314 | 9,118,861 | 0.51 |
| 10,001 – 100,000 shares | 218 | 4,743,067 | 0.26 | 7 | 228,134 | 0.01 | 225 | 4,971,201 | 0.27 |
| 100,001 – 1,000,000 shares | 6 | 1,041,065 | 0.06 | 1 | 179,407 | 0.01 | 7 | 1,220,472 | 0.07 |
| Over 1,000,000 shares | 8 | 974,878,200 | 54.01 | 1 | 811,757,869 | 44.98 | 9 | 1,786,636,069 | 98.99 |
| 12,200 | 992,573,253 | 54.99 | 47 | 812,286,747 | 45.01 | 12,247 | 1,804,860,000 | 100.00 | |
Categories of shareholders
| Category | No. of shareholders | No. of shares |
| Individual | 12,114 | 16,034,991 |
| Institution | 133 | 1,788,825,009 |
| 12,247 | 1,804,860,000 |
List of 20 major shareholders as at 31 December 2017
| Name | Shareholding | (%) | |
| 1. | Secretary to the Treasury | 893,405,709 | 49.50 |
| 2. | Global Telecommunications Holdings NV | 811,757,869 | 44.98 |
| 3. | Employees Provident Fund | 25,324,104 | 1.40 |
| 4. | Bank of Ceylon A/C Ceybank Unit Trust | 18,426,582 | 1.02 |
| 5. | Sri Lanka Insurance Corporation Ltd-Life Fund | 17,713,735 | 0.98 |
| 6. | National Savings Bank | 13,158,700 | 0.73 |
| 7. | Employees Trust Fund | 3,302,188 | 0.18 |
| 8. | Sri Lanka Insurance Corporation Ltd-General Fund | 2,041,538 | 0.11 |
| 9. | Bank of Ceylon A/C Ceybank Century Growth Fund | 1,505,644 | 0.08 |
| 10. | The Incorporated Trustees of the Church of Ceylon | 223,590 | 0.01 |
| 11. | Bank of Ceylon No. 1 Account | 214,000 | 0.01 |
| 12. | Pinnacle Trust (Pvt) Limited | 183,984 | 0.01 |
| 13. | Elgin Investment Limited | 179,407 | 0.01 |
| 14. | Ceylon Biscuits Limited | 162,000 | 0.01 |
| 15. | People's Leasing & Finance PLC / Mr C N Jayasooriya | 150,000 | 0.01 |
| 16. | Sinharaja Hills Plantation Pvt Limited | 107,491 | 0.01 |
| 17. | Mr Tanaka | 100,000 | 0.01 |
| 18. | Mrs Edirisinghe | 100,000 | 0.01 |
| 19. | Mr Van Starrex | 97,638 | 0.01 |
| 20. | Mr Weerasinghe | 70,000 | 0.00 |
| 1,788,224,179 | 99.08 |
Float adjusted Market Capitalisation as at 31 December 2017 – Rs. 2.83 billion.
Percentage of public holding as at 31 December 2017 – 5.52%.
Number of shareholders representing the public holding as at 31 December 2017 – 12,245.
Share price trend
| 2017 | 2016 | 2015 | 2014 | 2013 | 2012 | 2011 | 2010 | |
| Highest value (Rs.) | 36.70 | 46.40 | 54.90 | 57.30 | 50.00 | 50.00 | 64.50 | 51.00 |
| Lowest value (Rs.) | 27.00 | 31.20 | 43.00 | 33.33 | 36.10 | 34.00 | 44.00 | 35.00 |
| Last traded price (Rs.) | 28.50 | 36.00 | 47.00 | 49.90 | 37.00 | 44.50 | 48.00 | 49.00 |
| Market capitalisation (Rs. billion) | 51.43 | 64.97 | 84.83 | 90.00 | 66.78 | 80.32 | 86.63 | 88.44 |
Trading activity
| 2017 | 2016 | |
| No. of transactions | 3,149 | 3,328 |
| No. of shares traded | 1,463,787 | 3,082,282 |
| Value of shares traded (Rs.) | 46,137,965 | 112,724,951.40 |
Highlights
| 2017 | 2016 | |
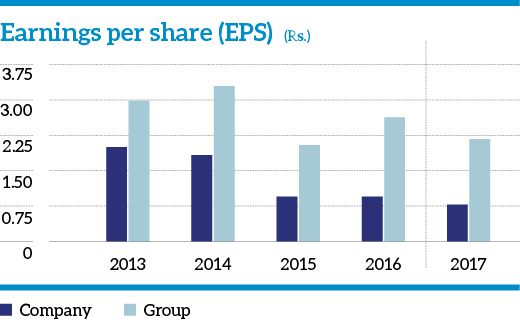
| Earnings per share (Rs.) | 2.18 | 2.65 |
| Net assets per share (Rs.) | 39.56 | 38.05 |
| Gearing ratio (Debt to Rs. 1/- of total equity) | 0.37 | 0.32 |
| Quick asset ratio (No. of times current liabilities) | 0.48 | 0.57 |
| Interest cover (Earnings before interest and taxes divided by interest expense) | 2.02 | 4.53 |
| Dividend payout ratio (%) | 40.8 | 33.5 |
| Dividend per share (Rs.) | 0.89 | 0.89 |
Earnings per share