Sri Lanka Telecom PLC
Annual Report
2020
Creating shared success
financial capital
Financial capital refers to the pool of financial resources SLT Group utilizes to acquire the assets and to fund the operations of the Group. By combining the financial capital with the other types of capital such as customer capital and employee capital, we create value for the short, medium and long-term for the Group and to all our stakeholders.
This section is an overview of our financial position and performance for the year under review, at both Group and Company levels.
The information presented below is duly supplemented with the Financial Statements and Notes.
In this section, “the Group” refers to Sri Lanka Telecom PLC and its subsidiaries and “SLT” refers to Sri Lanka Telecom PLC.
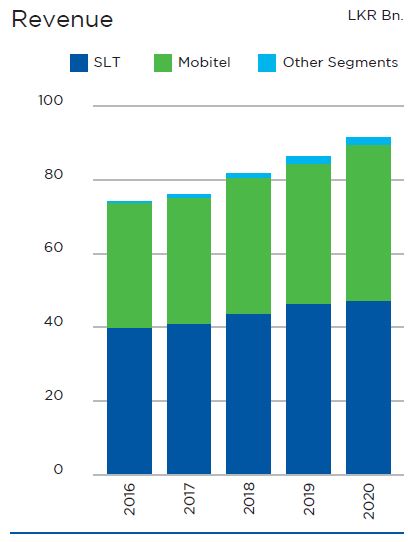
Revenue
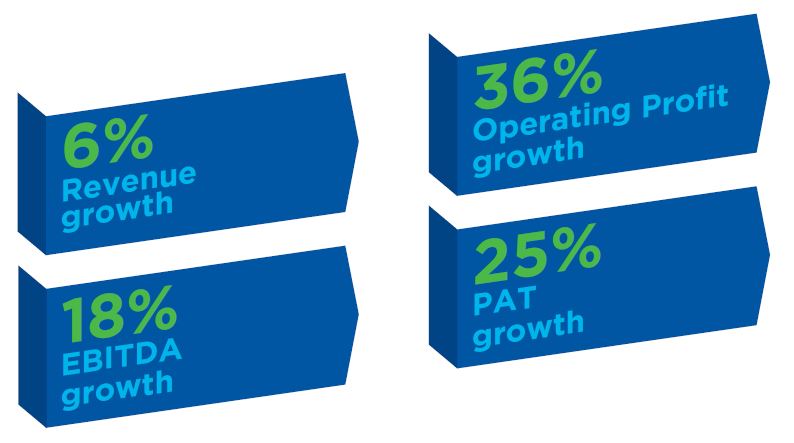
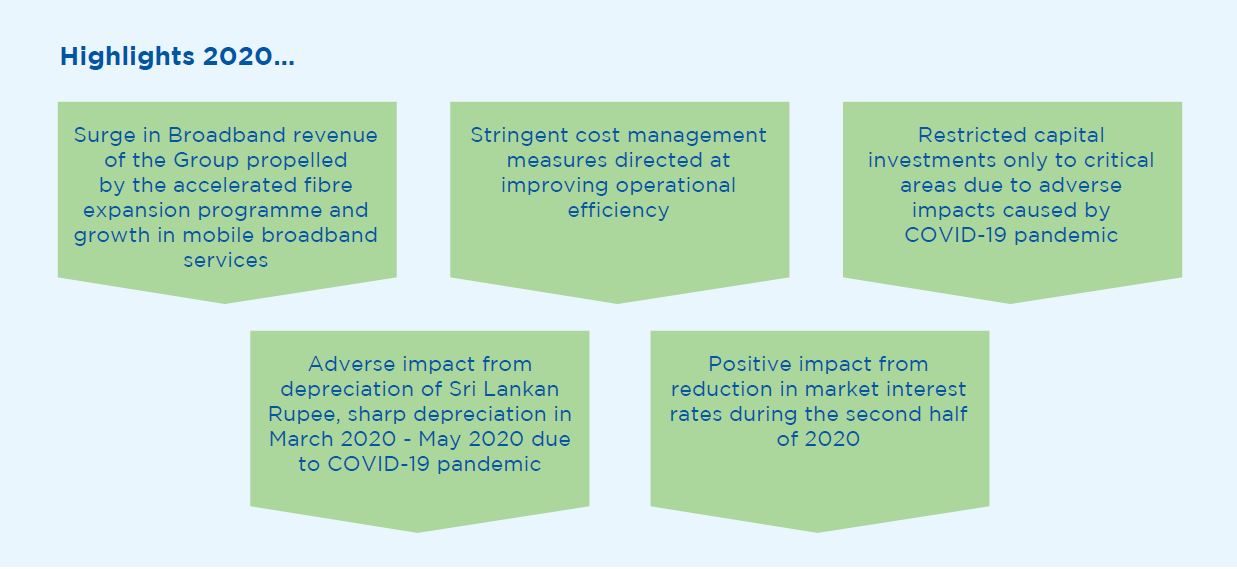
SLT Group recorded a steady growth of 6.0% in consolidated revenue for the financial year 2020 compared to the year before to LKR 91.1 Bn. Broadband revenue of the Group surged during the year propelled by the accelerated fibre expansion programme and growth in mobile broadband services. Revenue from PEOTV, 4G LTE and carrier domestic services too improved during the year. However, the Group experienced a de-growth in Voice revenues in both fixed and mobile voice services due to the global trend of adapting to data services over voice owing to the flexibility and lower cost in data services.
The Group experienced an increase in Broadband usage due to “Work From Home” arrangements and distance learning platforms during the year due to travel restrictions caused by the COVID-19 outbreak which contained throughout the year. However, as the national telecommunication services provider, the Group absorbed the adverse impact on revenue from providing free data offers, discounted voice offers, bundled telecom packages at concessionary rates to students, working from home users and corporate customers to assist the customers during the pandemic. Further, revenue of the Group was adversely impacted due to delays caused in capital projects owing to the unprecedented challenges posed by the pandemic.
The Group’s Fixed ICT segment which is operated by Sri Lanka Telecom PLC (SLT) contributed 51.7% to the Group revenue during the year under review while Mobile ICT segment operated by Mobitel (Pvt) Ltd (Mobitel) contributed 46.0%. Mobitel recorded a notable revenue growth of 7.9% compared to the year earlier whereas SLT recorded a moderate growth of 3.1%. The Group expects the revenue to further rise with the ongoing accelerated fibre expansion programme and the growing trend of over-the-top (OTT) services and Internet of Things (IoT) which will immensely increase the data volumes.
EBITDA & Operating Profit
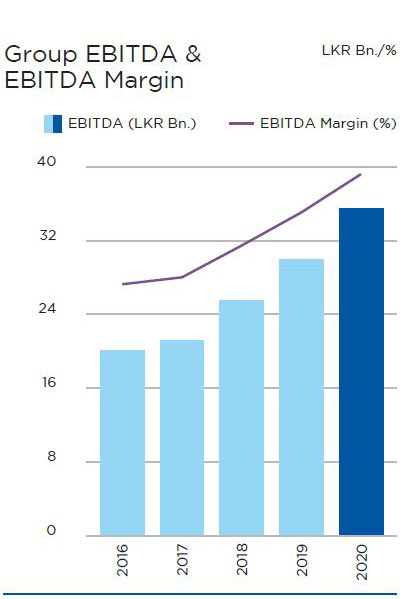
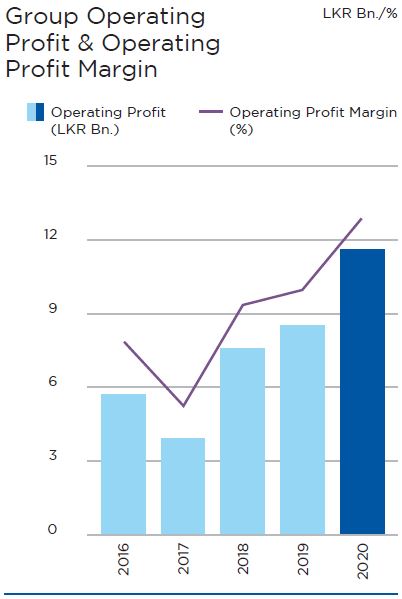
Earnings Before Interest, Tax, Depreciation & Amortisation (EBITDA) of the Group rose to LKR 35.5 Bn. reflecting an impressive 18.2% YoY growth. Stringent cost management measures of the Group maintained the Operating Expenses excluding depreciation & amortisation with a slight reduction of 0.5% in 2020 compared to 2019 at LKR 55.7 Bn. EBITDA margin of the Group climbed to 38.9% in 2020 from 34.9% in the year before. Depreciation and amortisation for the year was LKR 23.8 Bn. which is an 11.1% increase compared to 2019. The Operating Profit grew to LKR 11.6 Bn. recording a remarkable YoY growth of 36.2%.
SLT recorded an EBITDA of LKR 18.4 Bn., up by 12.0% over the previous year. The Company managed to reduce the Operating Expenses excluding depreciation & amortisation by 1.3% YoY even though the Repair and Maintenance Costs and Provision for Bad Debts elevated during the year. EBITDA Margin of SLT went up to 35.7% from 32.9% in 2019 and the Operating Profit improved to LKR 3.5 Bn., a 4.5% YoY growth.
EBITDA of Mobitel grew to LKR 16.5 Bn., reflecting a 22.8% YoY growth, lifting the EBITDA Margin to 38.1% from 33.5% in 2019. Mobitel recorded an impressive 49.5% increase in Operating Profit to LKR 7.8 Bn. during the year under review.
Profit After Tax
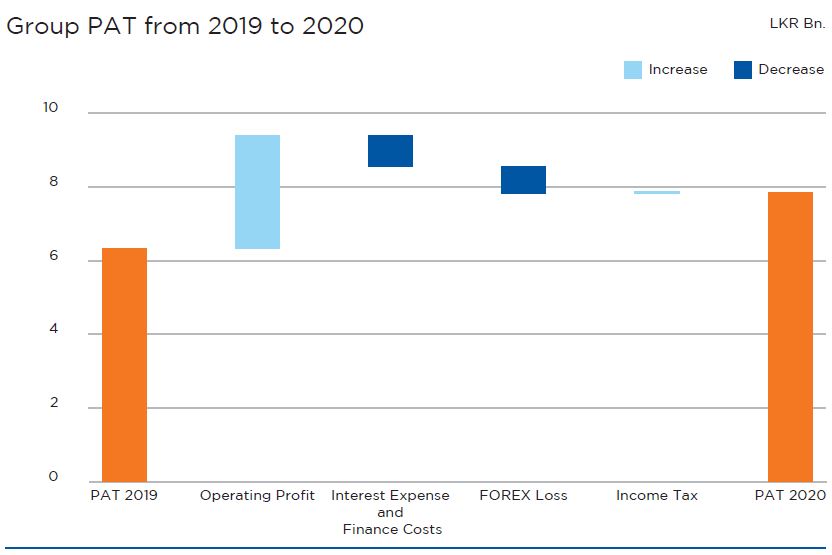
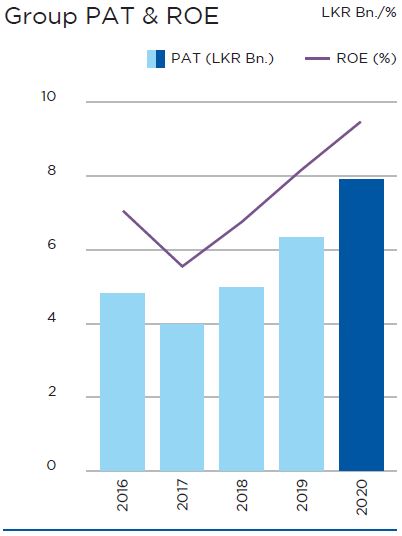
The Group concluded its financial year 2020 with a Profit After Tax (PAT) of LKR 7.9 Bn. demonstrating a remarkable growth of 24.7% compared to the previous year. The growth was strongly underpinned by the escalated revenue and improved operational efficiency attained through Group’s cost management initiatives.
Interest and Finance Costs of the Group declined by 5.5% over the year earlier due to reduction in Borrowings position during the year and reduction of market interest rates during the second half of 2020. However, the portion of Interest Costs charged to the Profit or Loss Statement increased during the year by LKR 0.8 Bn. compared to 2019, due to the lesser interest capitalisation for the year. FOREX losses of the Group climbed to LKR 1.2 Bn. for the year, up by LKR 0.8 Bn. compared to the year before emanating from the depreciation of Sri Lankan Rupee against US Dollar which includes the spike in US Dollars during March 2020 to May 2020 period caused by the Covid-19 pandemic and the hedge accounting adjustment in SLT Financial Statements due to the settlement of USD denominated borrowings during the year.
Profit Before Tax (PBT) of the Group rose to LKR 9.7 Bn. despite many challenges caused during the year, reflecting an impressive YoY growth of 18.2%.
SLT recorded a moderate growth in PAT of 6.3% YoY to LKR 4.0 Bn. for the year under review. Interest Expense and Finance Costs of SLT went up by LKR 0.7 Bn. YoY to LKR 1.4 Bn. due to the lesser capitalisation of interest during the year. SLT incurred a FOREX Loss of LKR 0.7 Bn. during the year due to the hedge accounting adjustment on settlement of USD denominated borrowings and the depreciation of Sri Lankan Rupee against US Dollar during the year. The Dividend Income doubled to LKR 1.0 Bn. for the year. PBT of SLT stood at LKR 4.5 Bn., a decline by 4.5% YoY owing to the adverse impacts from Interest Expense and Finance Costs and FOREX losses.
Mobitel reported a remarkable growth in PAT of 51.4% YoY to LKR 4.9 Bn. for the year 2020. The growth was strongly underpinned by the increase in Operating Profit by 49.5% to LKR 7.8 Bn. However, Mobitel experienced an increase in FOREX losses by LKR 0.3 Bn. to LKR 0.5 Bn. and an increase in Income Tax Expenses by LKR 0.4 Bn. to LKR 1.2 Bn. for the year.
The Group paid a total amount of LKR 17.1 Bn. as direct and indirect taxes including levies to the Government of Sri Lanka during the financial year 2020.
Return on Equity (ROE) of the Group climbed to 9.4% in 2020 from 8.1% in 2019 due to the impressive growth in Group PAT by 24.7% for the year.
Assets
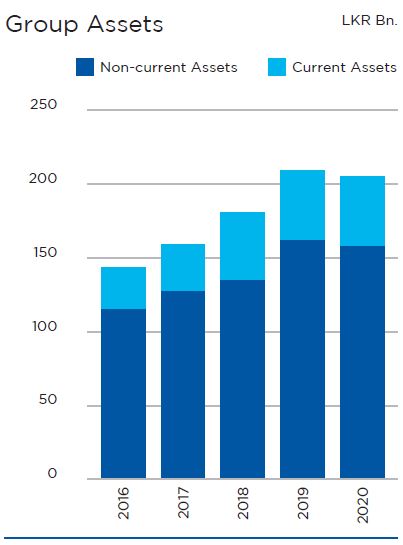
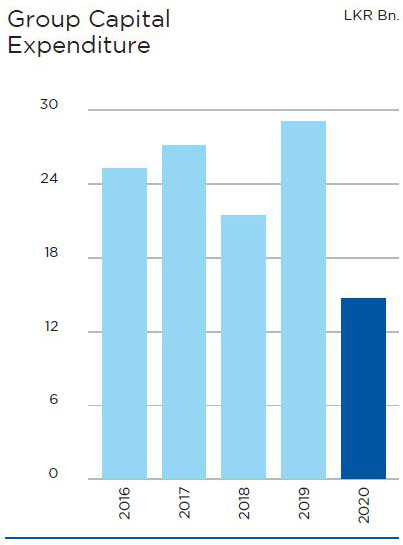
The Group’s asset base comprised of 77.1% Non-Current Assets and 22.9% Current Assets as at the end of the reporting period. As the Group is in the telecommunication industry which is highly capital intensive in nature, 71.1% of the asset base as at 31 December 2020 was comprised of Property, Plant & Equipment and Intangible Assets. During the year, the Group’s capital expenditure declined by 49.7% YoY to LKR 14.6 Bn. owing to the restriction of capital expenditure only for critical areas due to the many challenges posed by the Covid-19 pandemic.
During the year under review, the Group continued its strategic investments mainly directed at expansion of Fibre-to-the-Home (FTTH) network, Internet Protocol Television (IPTV) network which offers services under the brand name PEOTV, Transport Network and Mobile network under Mobitel.
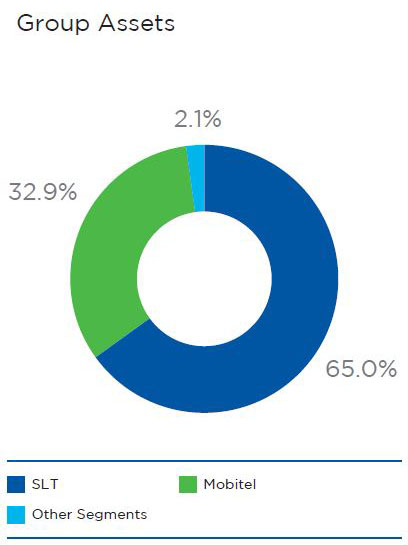
As at 31 December 2020, SLT accounted for 65.0% of the total asset base of the Group in comparison to 32.9% of Mobitel due to the more capital intensive nature of fixed telecommunication services than the mobile telecommunication services.
Capital Structure
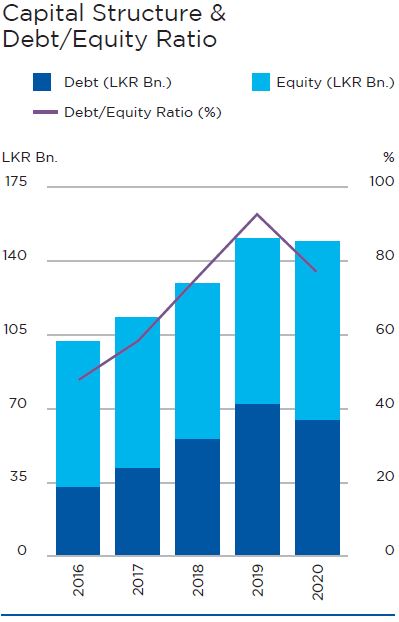
The Group’s total Equity amounted to LKR 84.3 Bn. as at the end of the reporting period, which reflects a 7.8% growth in compared to 31 December 2019 mainly due to the accumulated profits during the year. The Group strengthened its Financial Position during the year by reducing the Debt/ Equity Ratio from 92.8% in 31 December 2019 to 77.3% in 31 December 2020 underpinned by the accumulated profits and the reduction in Borrowings during the year. The Group managed the capital expenditure without obtaining any long-term borrowings during the year and thereby reduced the Borrowings as at 31 December 2020 to LKR 55.4 Bn. from LKR 61.7 Bn. as at 31 December 2019.
Similarly, SLT improved its Debt/Equity Ratio to 77.0% in 2020 from 88.1% in 2019 and Mobitel improved its Debt/ Equity Ratio to 17.3% in 2020 from 28.4% in 2019.
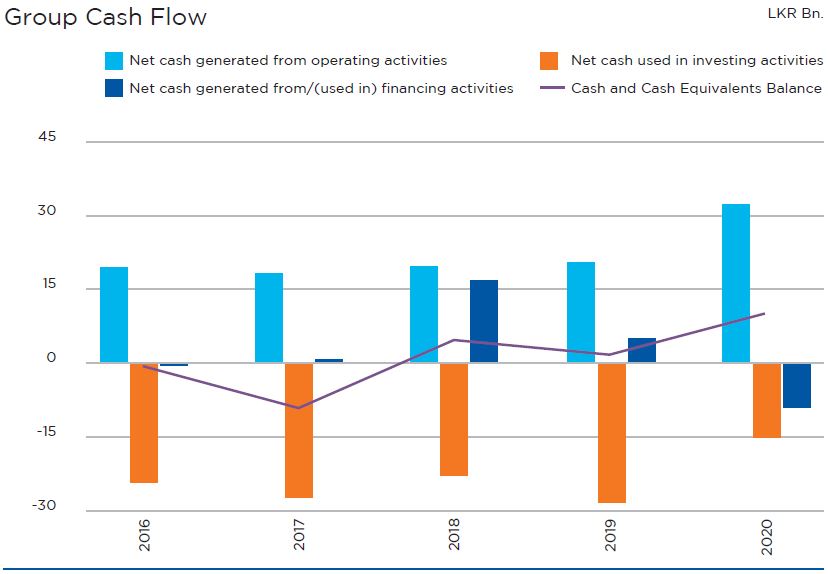
Cash Flow
Net cash generated from operating activities of the Group went up by 58.3% YoY to LKR 32.3 Bn. due to the escalated revenue and improved collections during the year. Net cash used in investing activities declined from LKR 28.3 Bn. in 2019 to LKR 15.0 Bn. in 2020 as a result of the reduction in acquisition of Property, Plant and Equipment during the year from LKR 28.0 Bn. in 2019 to LKR 12.1 Bn. in 2020. The Group obtained LKR 17.9 Bn. short-term borrowings during the year and settled LKR 23.2 Bn. short-term and long-term borrowings. SLT managed to settle all its foreign currency denominated borrowings during the year as a strategy to mitigate foreign exchange risk arising due to currency fluctuations. Due to higher settlement of borrowings over proceeds from borrowings, net cash used in financing activities recorded an outflow of LKR 9.0 Bn. for the year. The Group concluded the financial year with a favourable Cash and Cash Equivalents balance of LKR 10.0 Bn. compared to LKR 1.7 Bn. in the year before.
SLT reported a net increase in Cash and Cash Equivalents of LKR 2.2 Bn. during the year under review. However, the unfavourable opening Cash and Cash Equivalents balance of LKR 2.6 Bn. resulted a LKR 0.4 Bn. unfavourable Cash and Cash Equivalents balance as at the end of the reporting period. Mobitel concluded the financial year with a favourable Cash and Cash Equivalents balance of LKR 10.6 Bn. due to the net increase in Cash and Cash Equivalents during the year and favourable opening Cash and Cash Equivalents balance of LKR 6.2 Bn. and LKR 4.5 Bn. respectively.
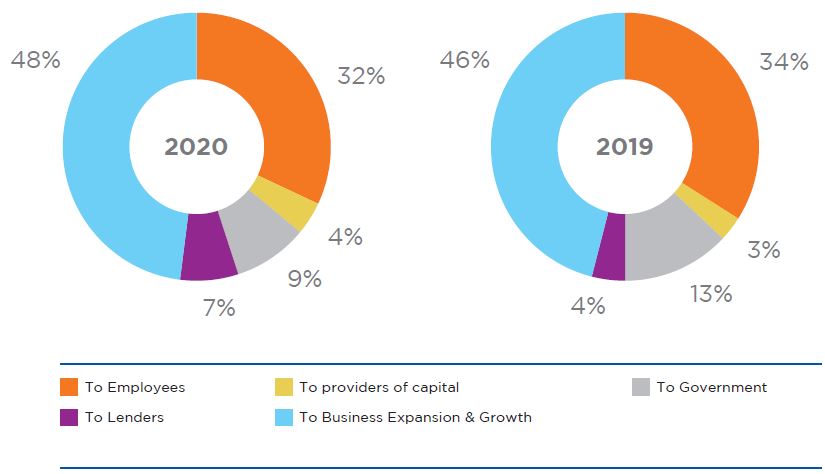
Value added statement
| 2020 | 2019 | |||
| LKR Mn. | (%) | LKR Mn. | (%) | |
| Value added | ||||
| Revenue | 91,119 | 85,948 | ||
| Other Income | 2,186 | 2,187 | ||
| 93,305 | 88,135 | |||
| Goods and services purchased from other sources | (32,466) | (31,693) | ||
| Value creation | 60,839 | 56,442 | ||
| Distribution of value added | ||||
| To Employees | ||||
| – Salaries, wages, and other benefits | 19,268 | 31.67 | 19,108 | 33.85 |
| To providers of capital | ||||
| – Dividend to shareholders | 2,689 | 4.42 | 1,913 | 3.39 |
| To Government | ||||
| – Taxes and regulatory fees | 5,768 | 9.48 | 7,057 | 12.50 |
| To Lenders | ||||
| – Interest and related charges | 4,105 | 6.75 | 2,510 | 4.45 |
| To business expansion and growth | ||||
| – Depreciation | 23,817 | 39.15 | 21,445 | 37.99 |
| – Retained income | 5,192 | 8.53 | 4,409 | 7.82 |
| 60,839 | 100.00 | 56,442 | 100.00 | |