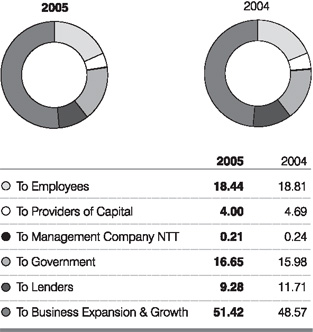
| DISTRIBUTION OF VALUE ADDED |
|
|
|
|
| To Employees- salaries, wages, & other benefits |
4,144 |
18.44 |
3,619 |
18.81 |
| To Providers of Capital
- dividend to shareholders |
902 |
4.00 |
902 |
4.69 |
| To Management Company NTT
- remuneration & expenditure |
47 |
0.21 |
47 |
0.24 |
| To Government
- taxes & regulatory fees |
3,742 |
16.65 |
3,073 |
15.98 |
| To Lenders
- interest & related charges |
2,085 |
9.28 |
2,252 |
11.71 |
| To Business Expansion & Growth |
|
|
|
|